How the Groceries Tracker Works
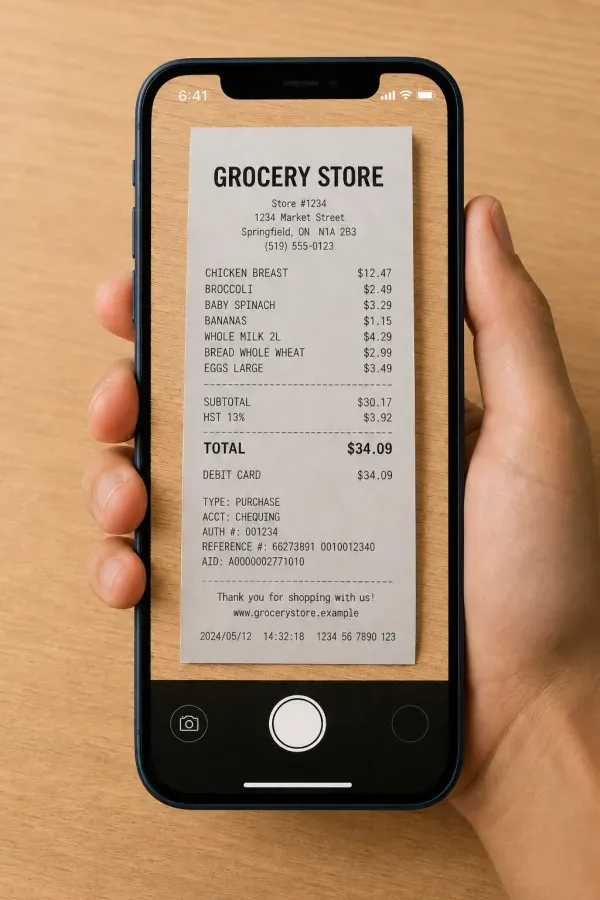
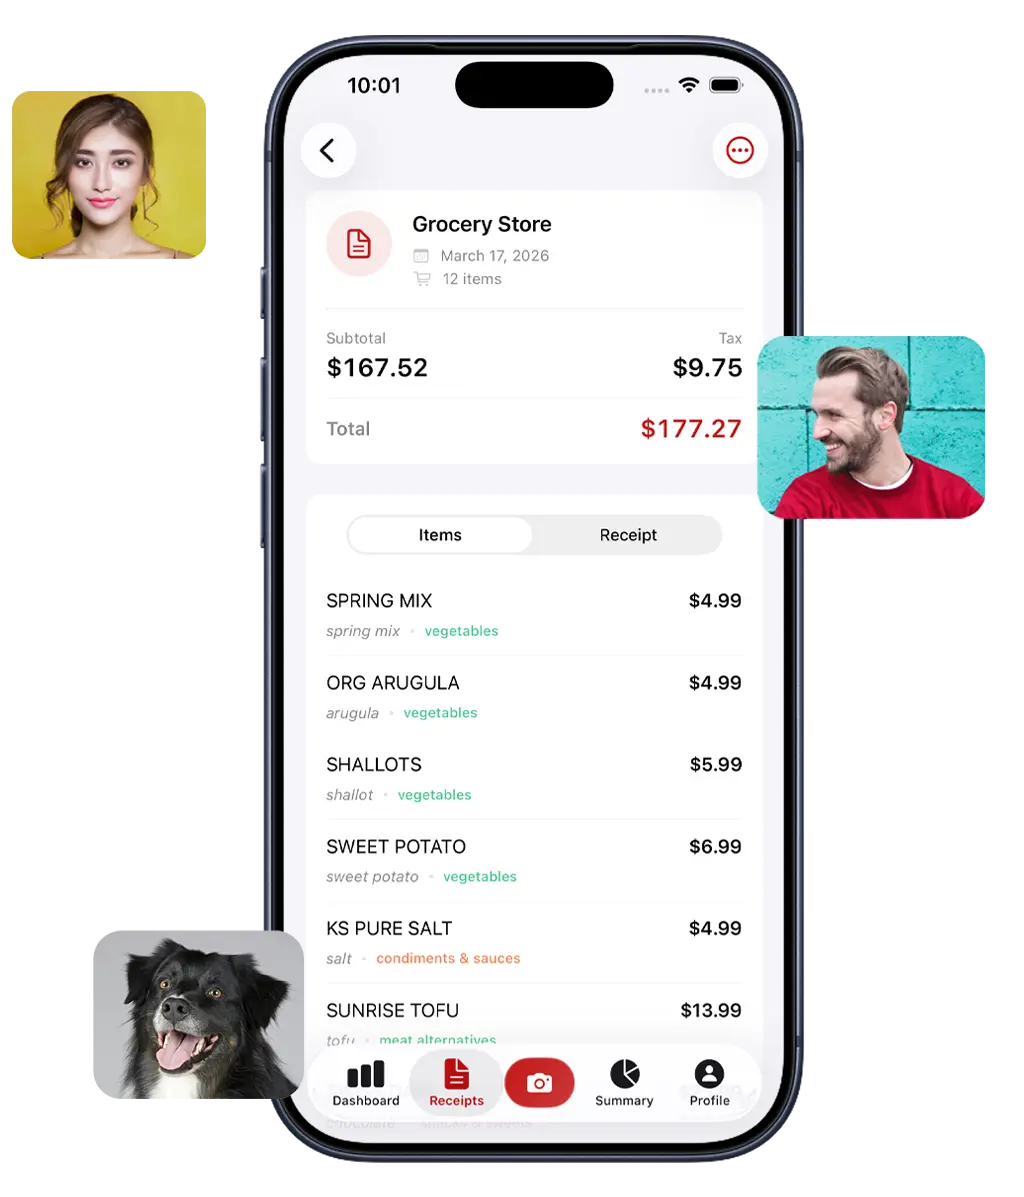
Scan Your Grocery Receipt
Snap a photo or upload a PDF and our receipt scanner instantly reads and categorizes every item and price. In seconds you'll see exactly where your money went. Including the impulse buys that are easy to forget but hard on your wallet.
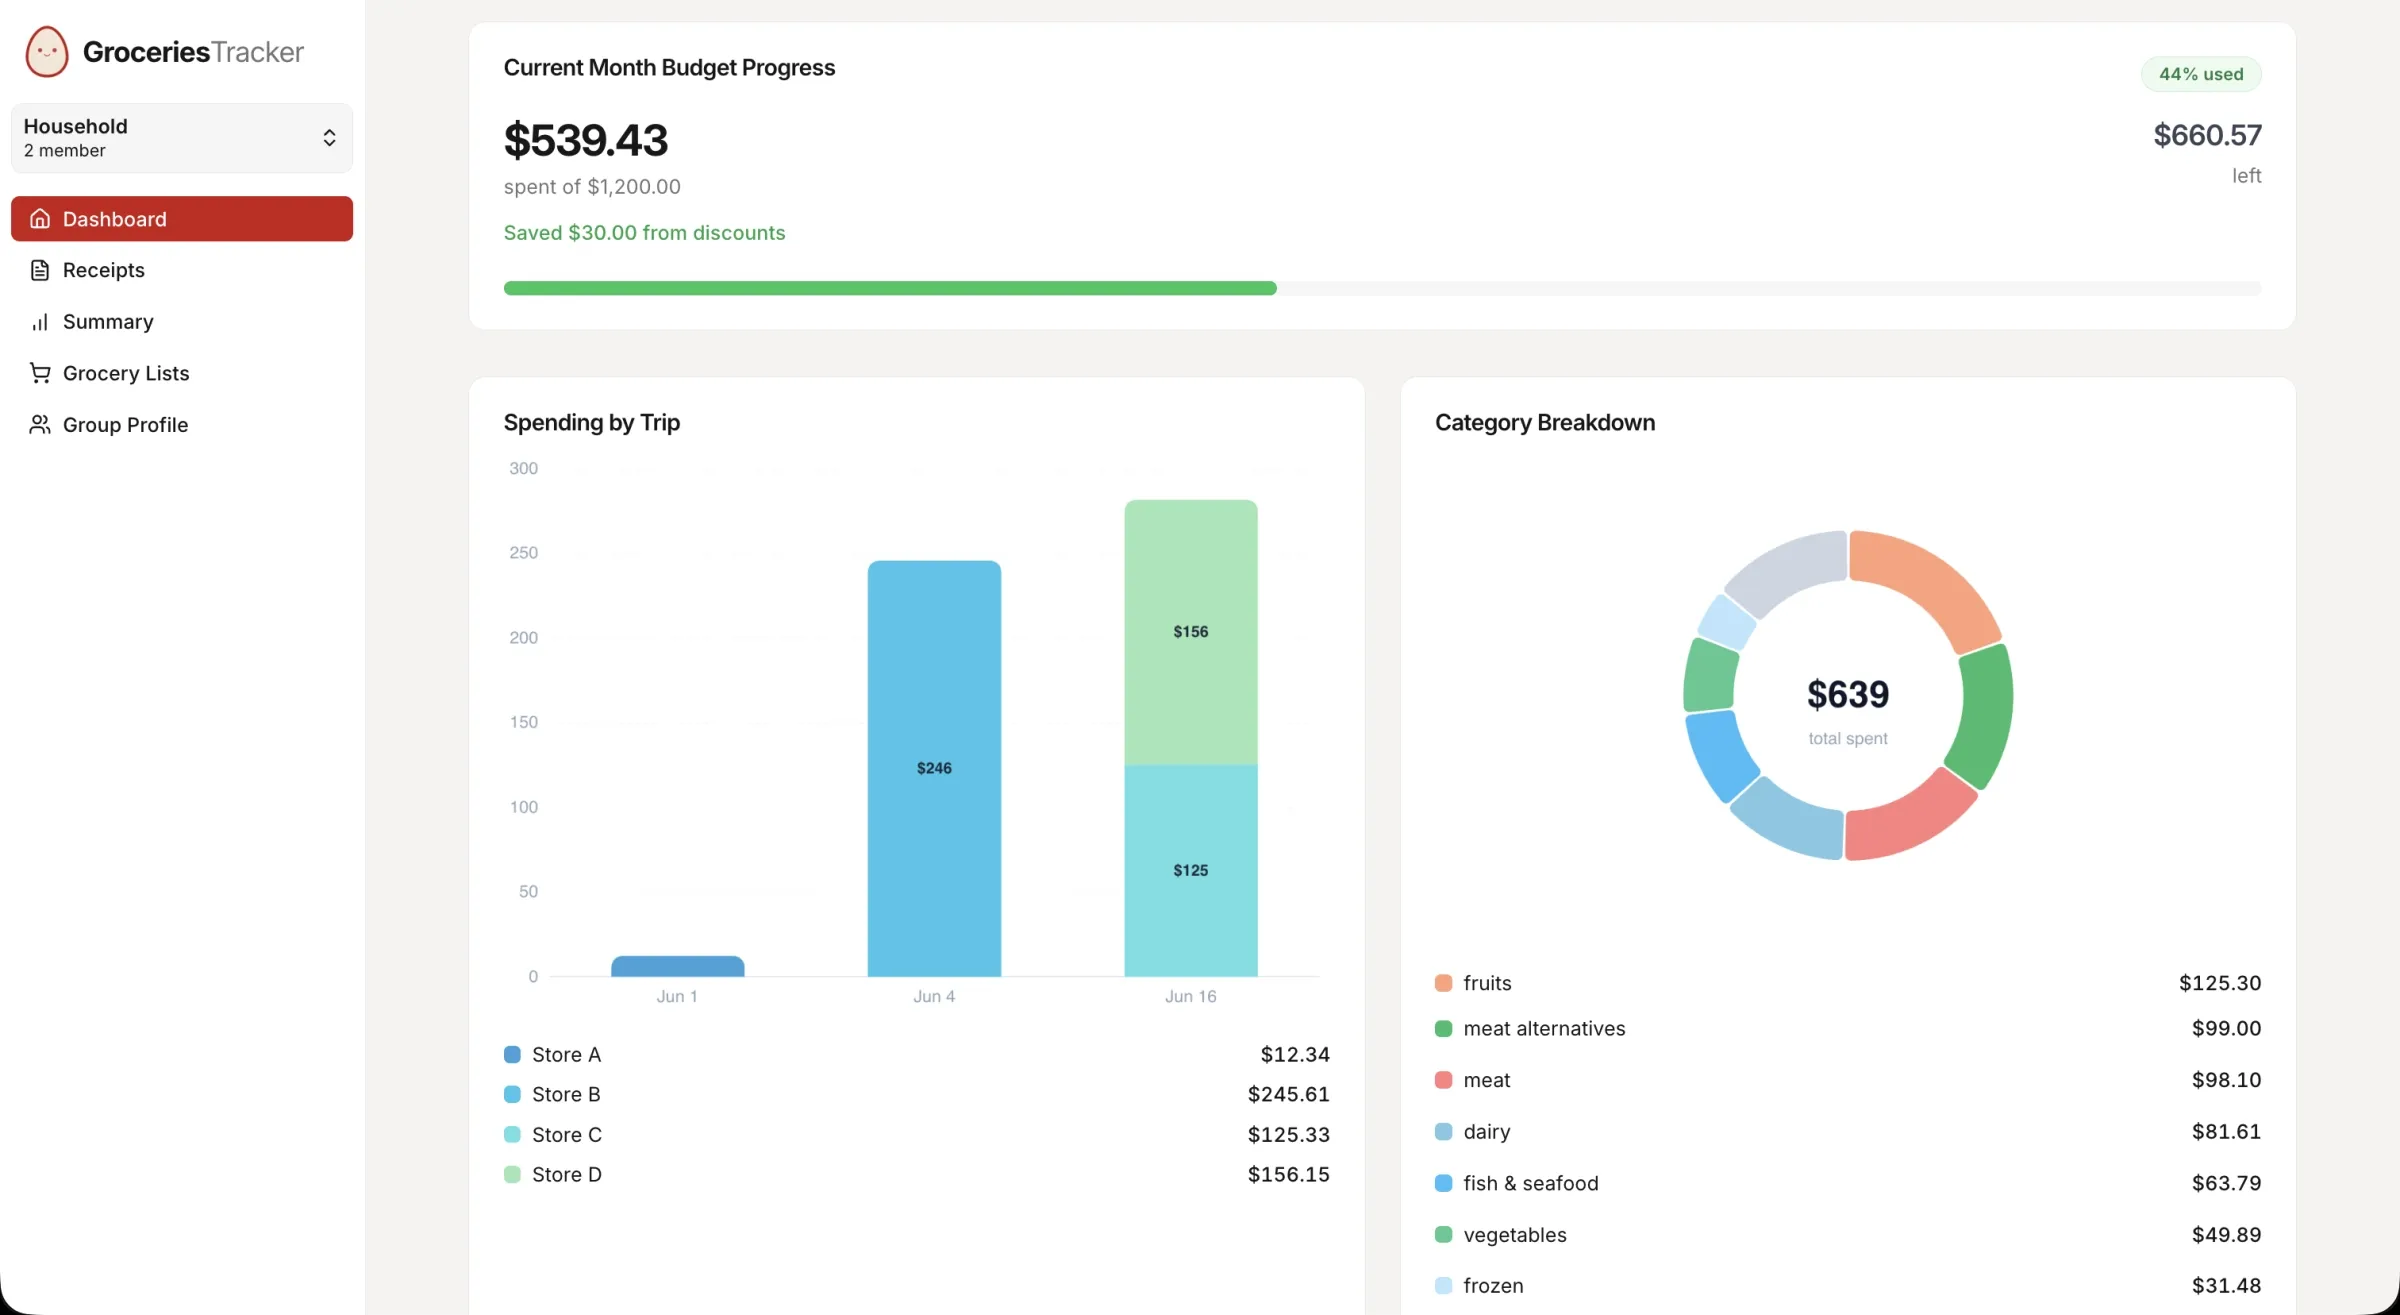
Track Every Item and Category
Get a complete spending breakdown by category and compare prices across stores. Find where you're overpaying, spot which habits cost the most, and see exactly how much you could save by switching stores for key items.
Share with Your Household
Everyone sees the same receipts and budget. No more duplicate purchases, no more surprise grocery bills. Households that track together find savings faster because nothing slips through the cracks.
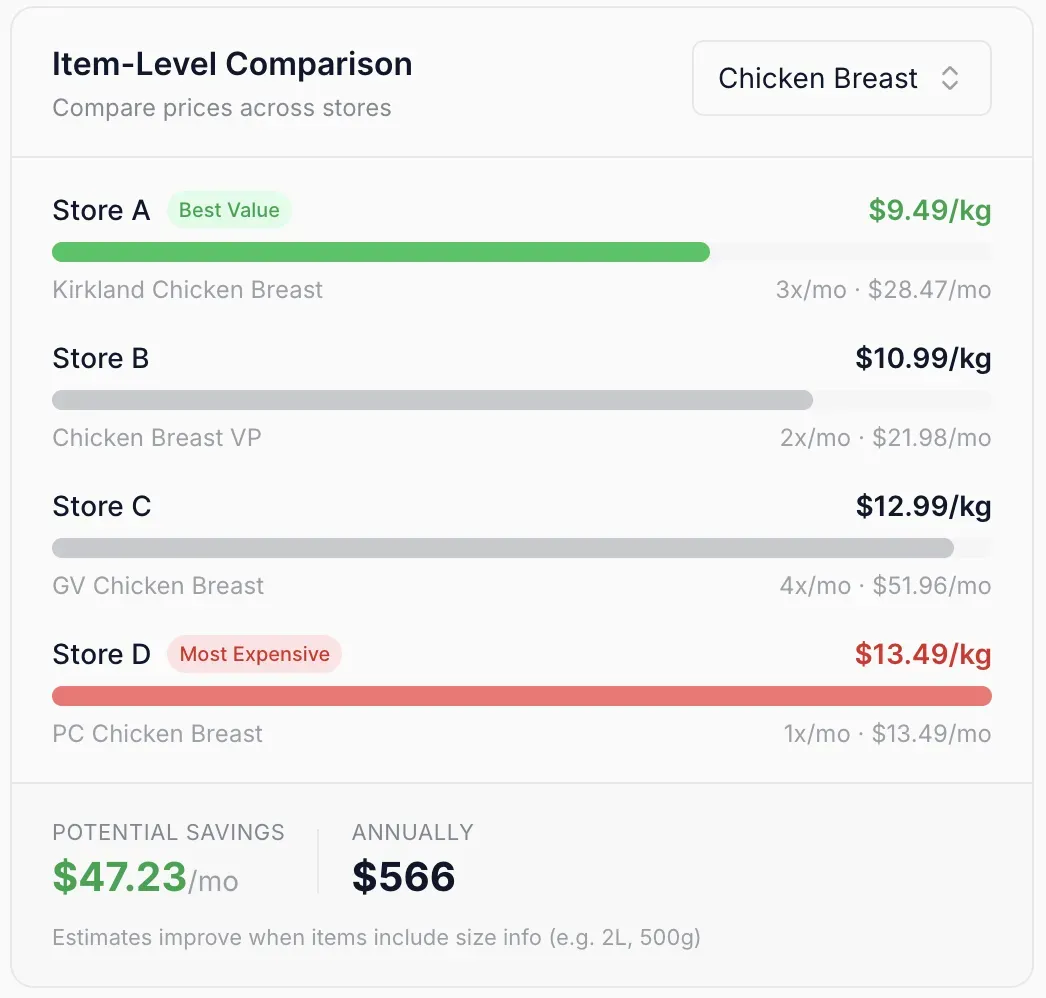
Compare Grocery Prices Across Stores
Find where the items you buy most cost less, and exactly how much you could save by switching stores
Life Before and After Groceries Tracker
See what changes when you finally know where your grocery money actually goes
Before
Bank says "GROCERY - $147" but won't tell you what you bought
Notice you're overspending only when it's too late
Buy duplicates because you forgot what's in the pantry
Arguments about who spent what and why the bill is high
Start tracking spreadsheets, abandon them after a week
Receipts scattered everywhere or lost completely
After
Upload receipts -> see every item organized automatically
Know exactly what you're spending on: snacks, produce, household items, etc
Spot patterns like "quick trips" that add up fast
Share with household, everyone sees the same data
Make better decisions without guilt or restriction
Actually understand your grocery budget
Free to start. $5/mo when you're ready. See pricing →
Every sale you caught, finally counted.
You save every time you buy on sale, you just never see it add up. Scan a receipt and we total every discount, so you can finally see what those small wins are worth.
Saved this month
Last month
April
Start seeing yours. Get started →
Grocery Expense Tracker Features
Everything you need to track grocery spending, stay on top of your food budget, and stop overpaying
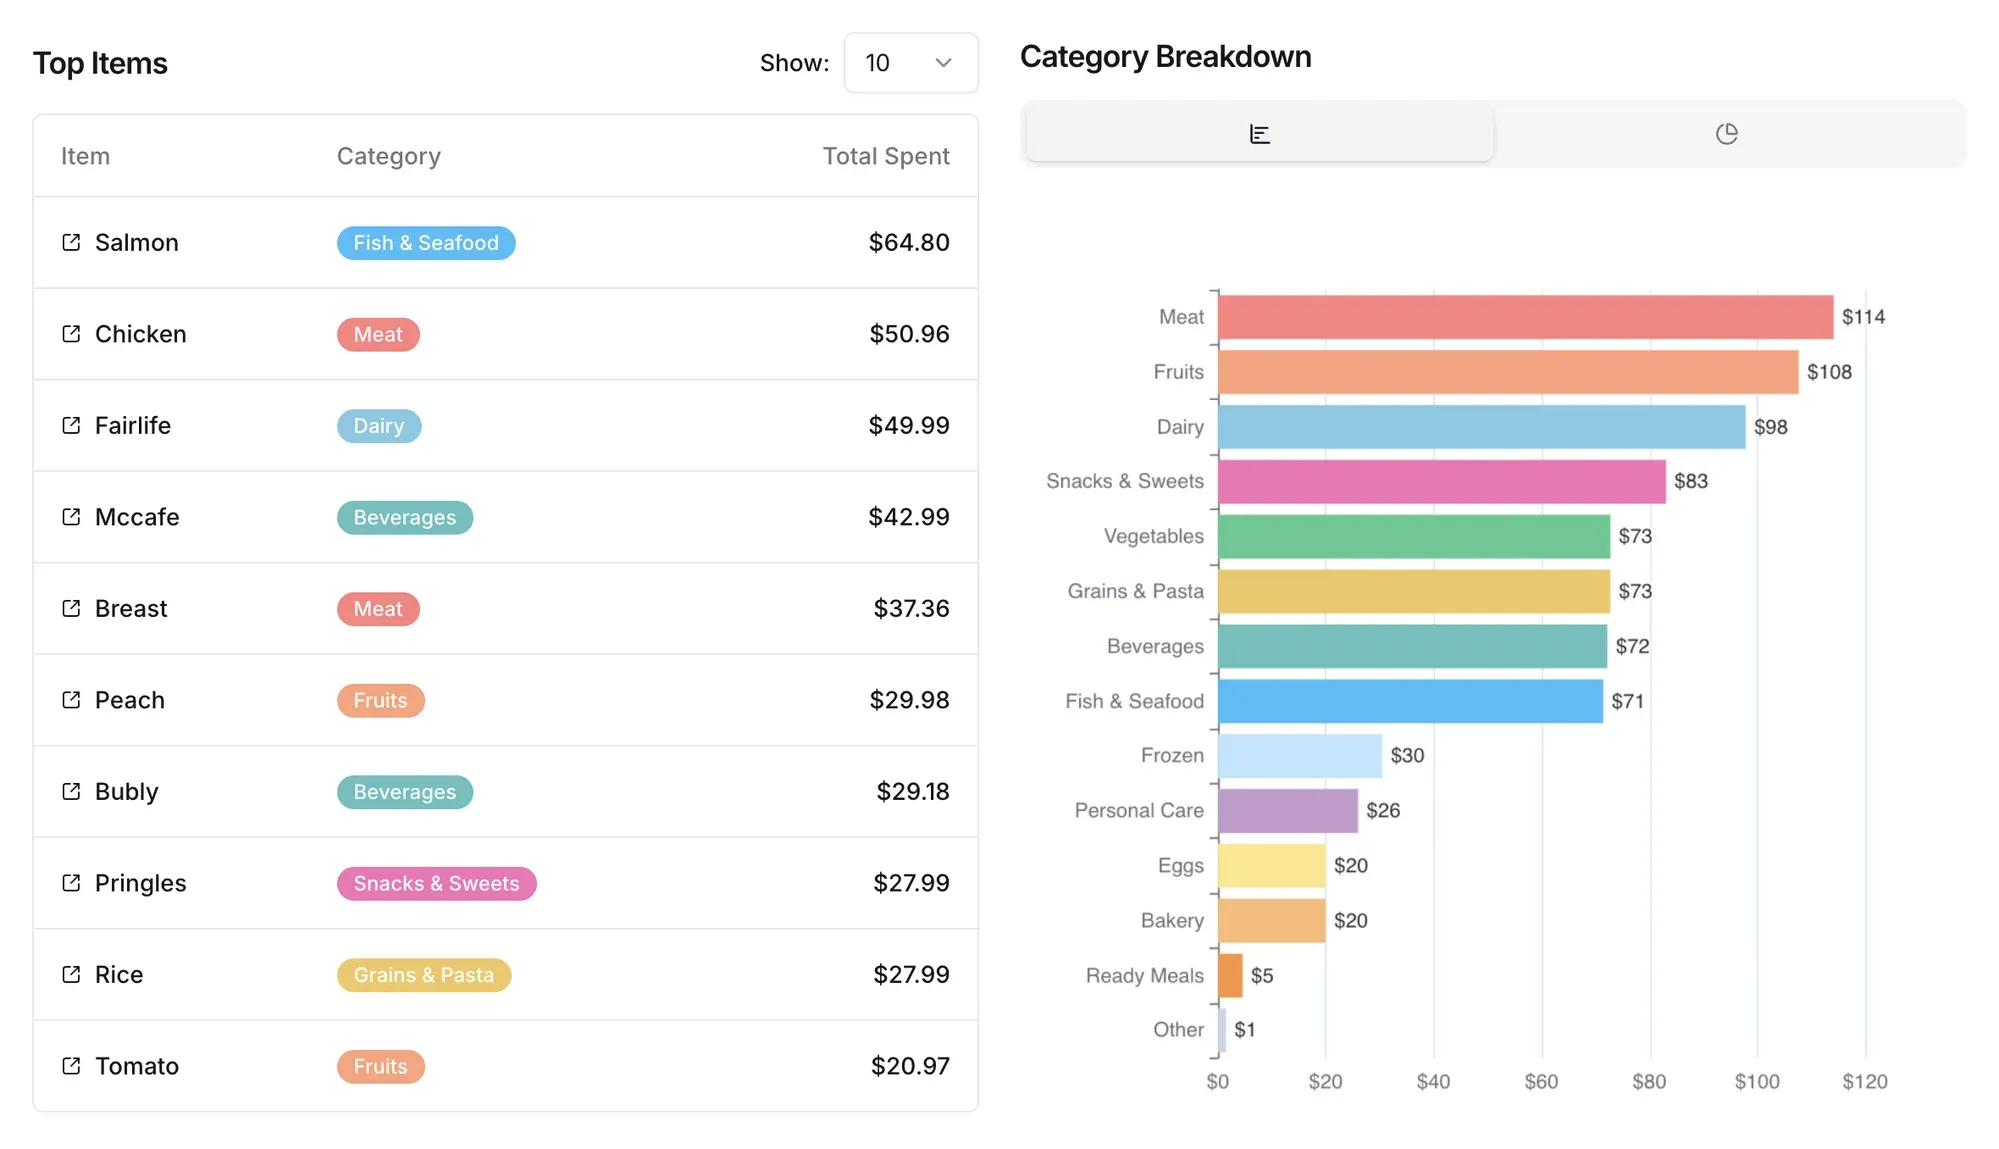
Item-Level Visibility
Your bank shows "GROCERY." We show the $12 snack run, the impulse drinks, and the duplicate buys you didn't notice. The waste becomes obvious.
Learn more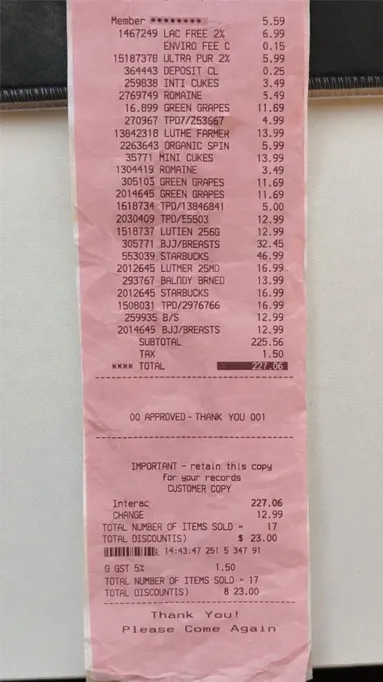
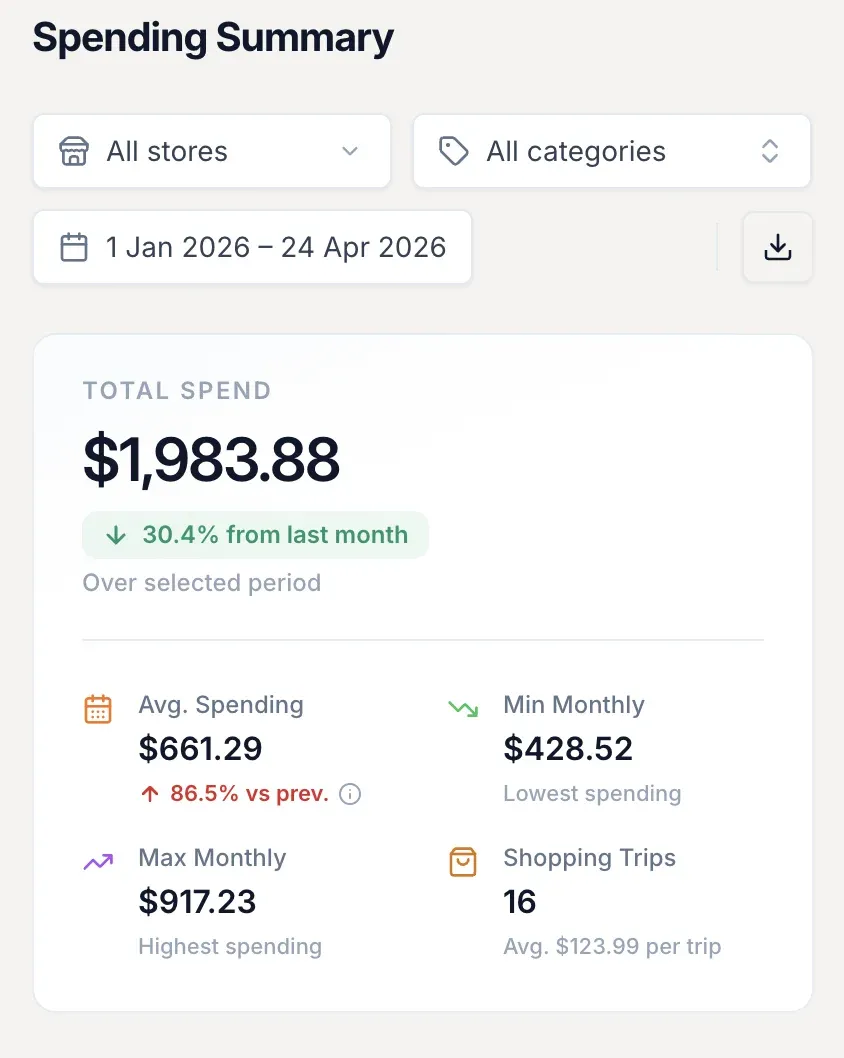
Spending Patterns
Compare this month to last and spot the patterns costing you money. Those "quick trips" add up to hundreds.
Learn more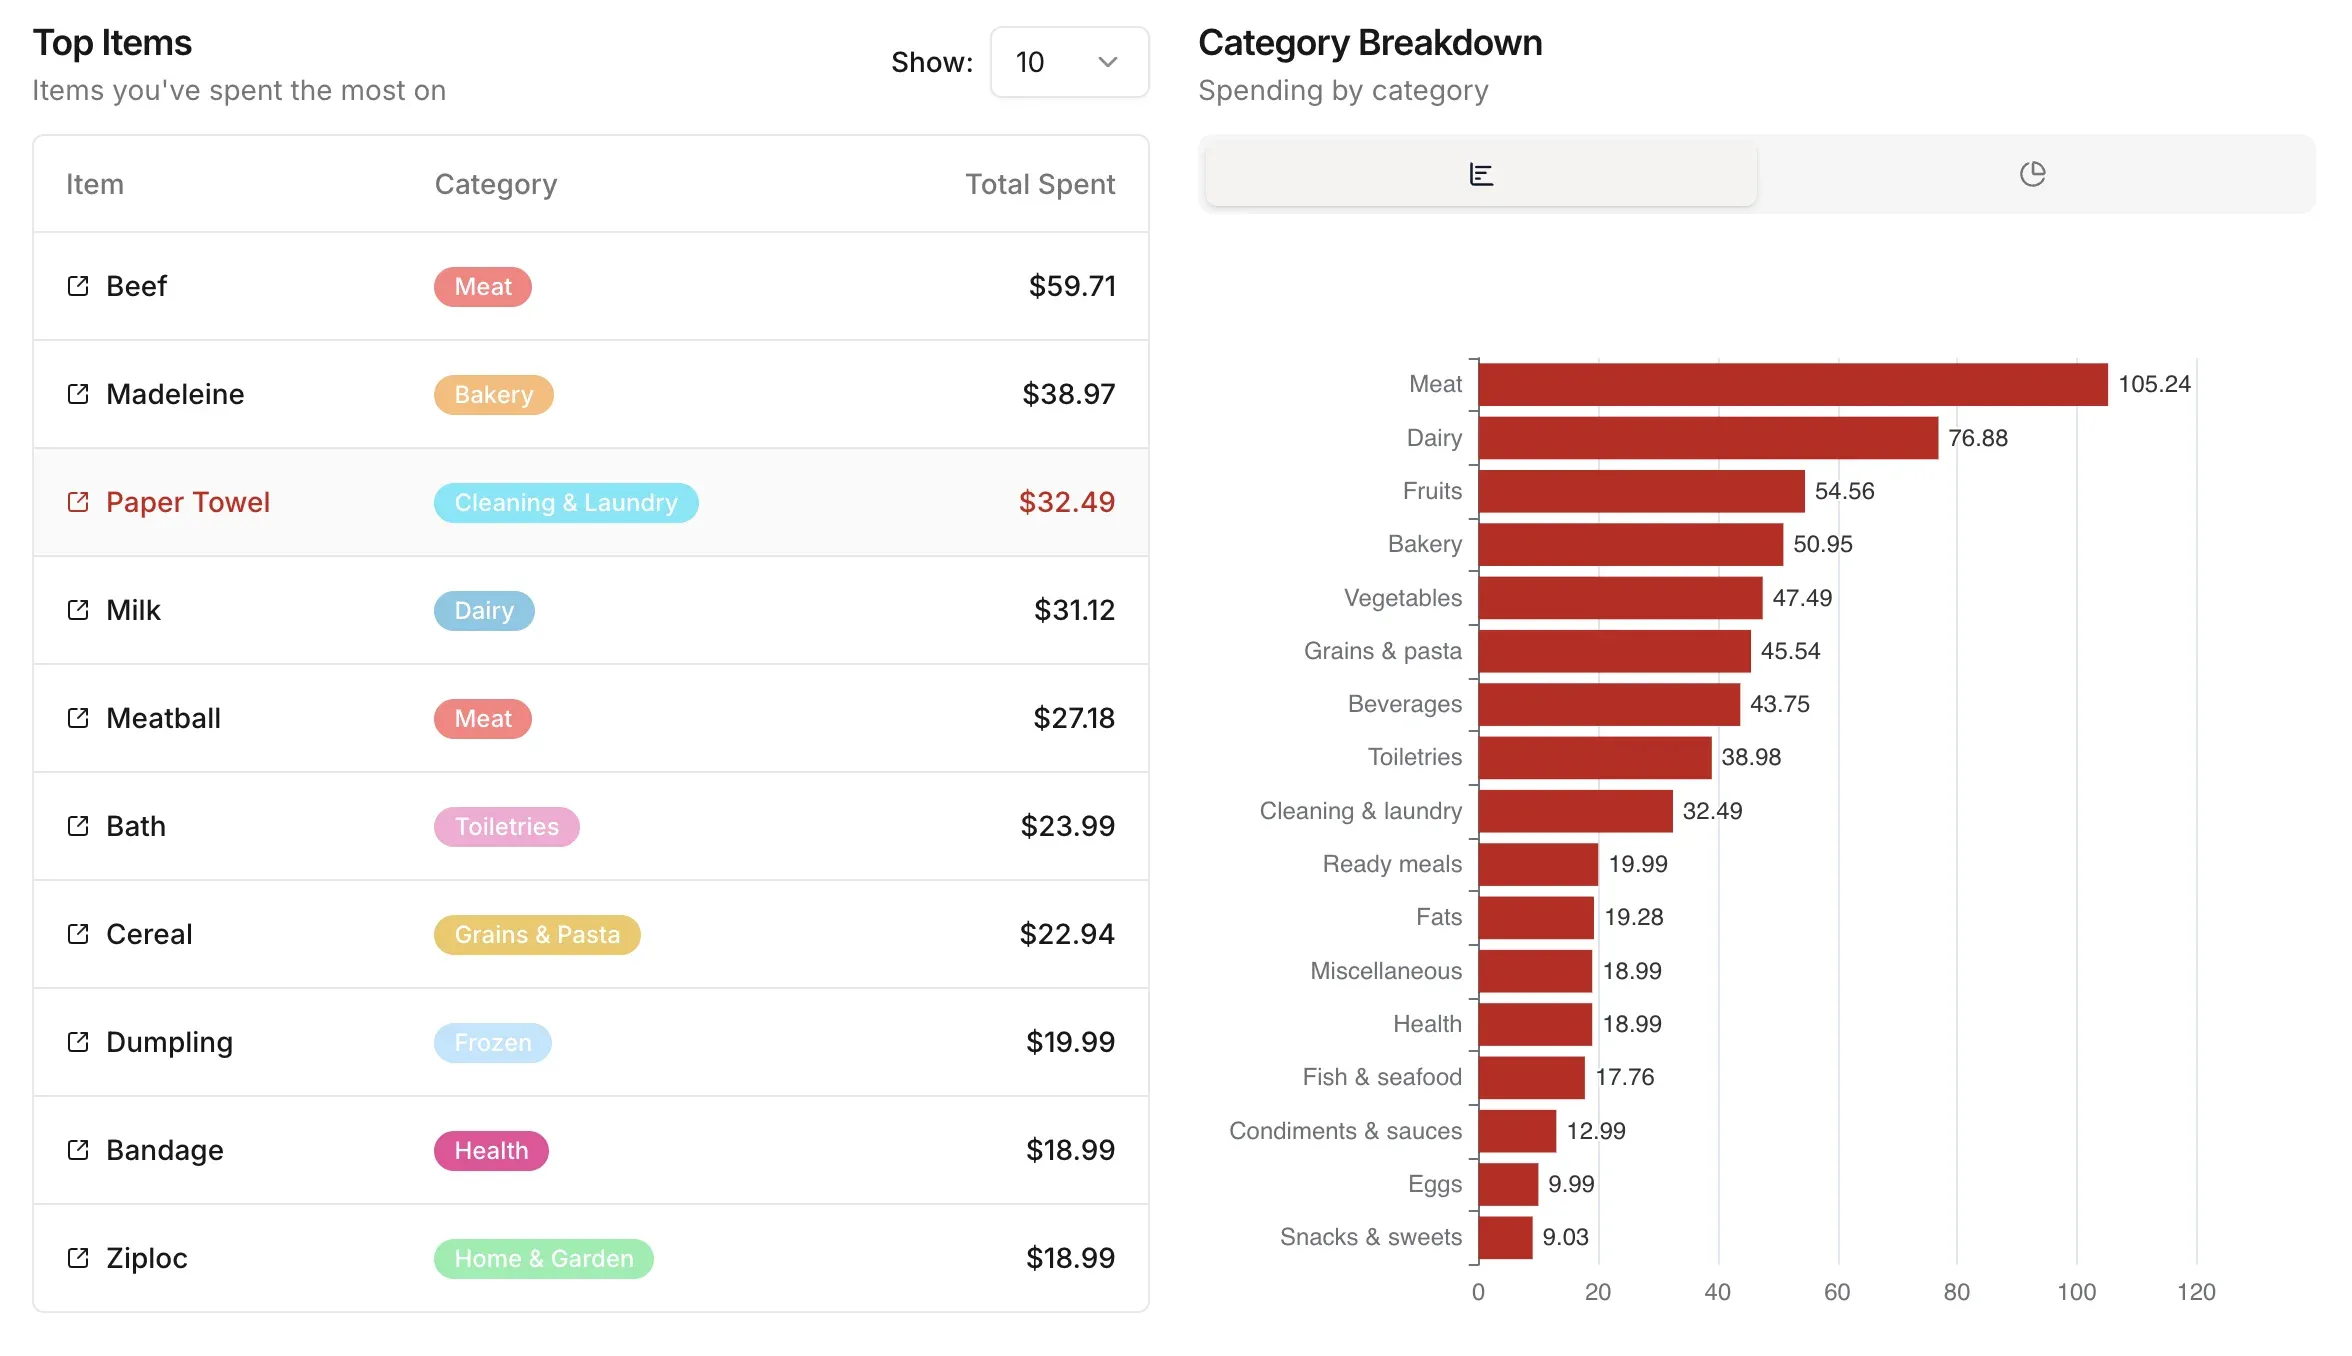
Savings Goals
Pick something small worth saving for. Every month you spend less than households like yours on groceries, the difference goes straight to your goal instead of slipping away.
Learn moreStore Price Comparison
Pick any item and instantly see what you paid at every store. We highlight the cheapest option and show your potential monthly and annual savings if you switch.
Learn more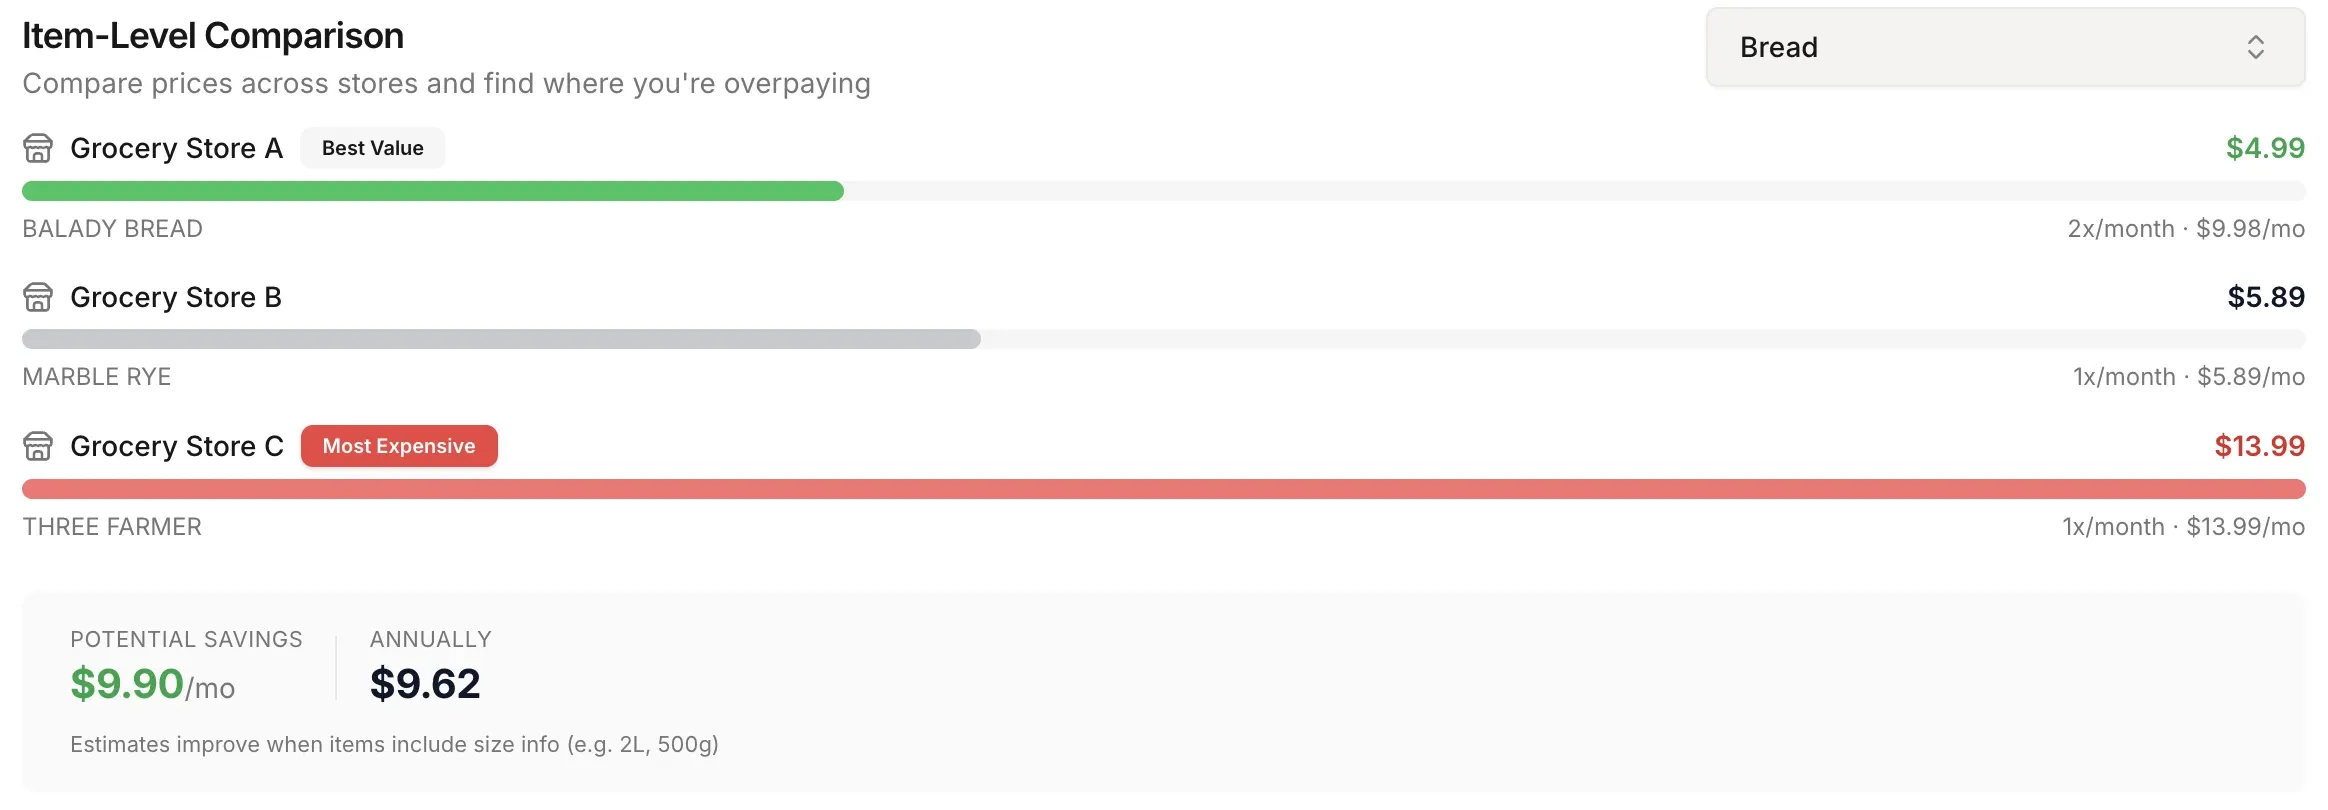
People stick with it
The spreadsheet got abandoned. This becomes part of the routine.
I just started using it about a month ago. It makes it so much easier to track my food expenses, especially when I buy at Costco where you can get more than food. I love that I just have to upload my bill and it automatically puts everything in categories with graphs with little editing. Very impressive!
Véronique
I tried several apps, and AI actually recommended this one over most. What I love is how easy and addictive it is, when I'm at the grocery store, I just scan and upload, and I don't even take the receipt home anymore. It's become part of my routine. I love business startups, and I think this is a great product.
KK
"We'll Never Sell Your Data. Ever."
Your Privacy Actually Matters Here
Most budgeting apps make money by selling your data to advertisers and data brokers.
Groceries Tracker doesn't. Ever.
We make money from subscriptions. Your data is always yours.
No ads. No shady business model.